 Manual
Manual · The book
Debugging
Breakpoints, stepping, the query log — on real data.
Debug is Run, plus truth
The Debug button starts the same application against the same development database — with the debugger attached. It is made to be usable on real data, because the bug you are hunting lives there.
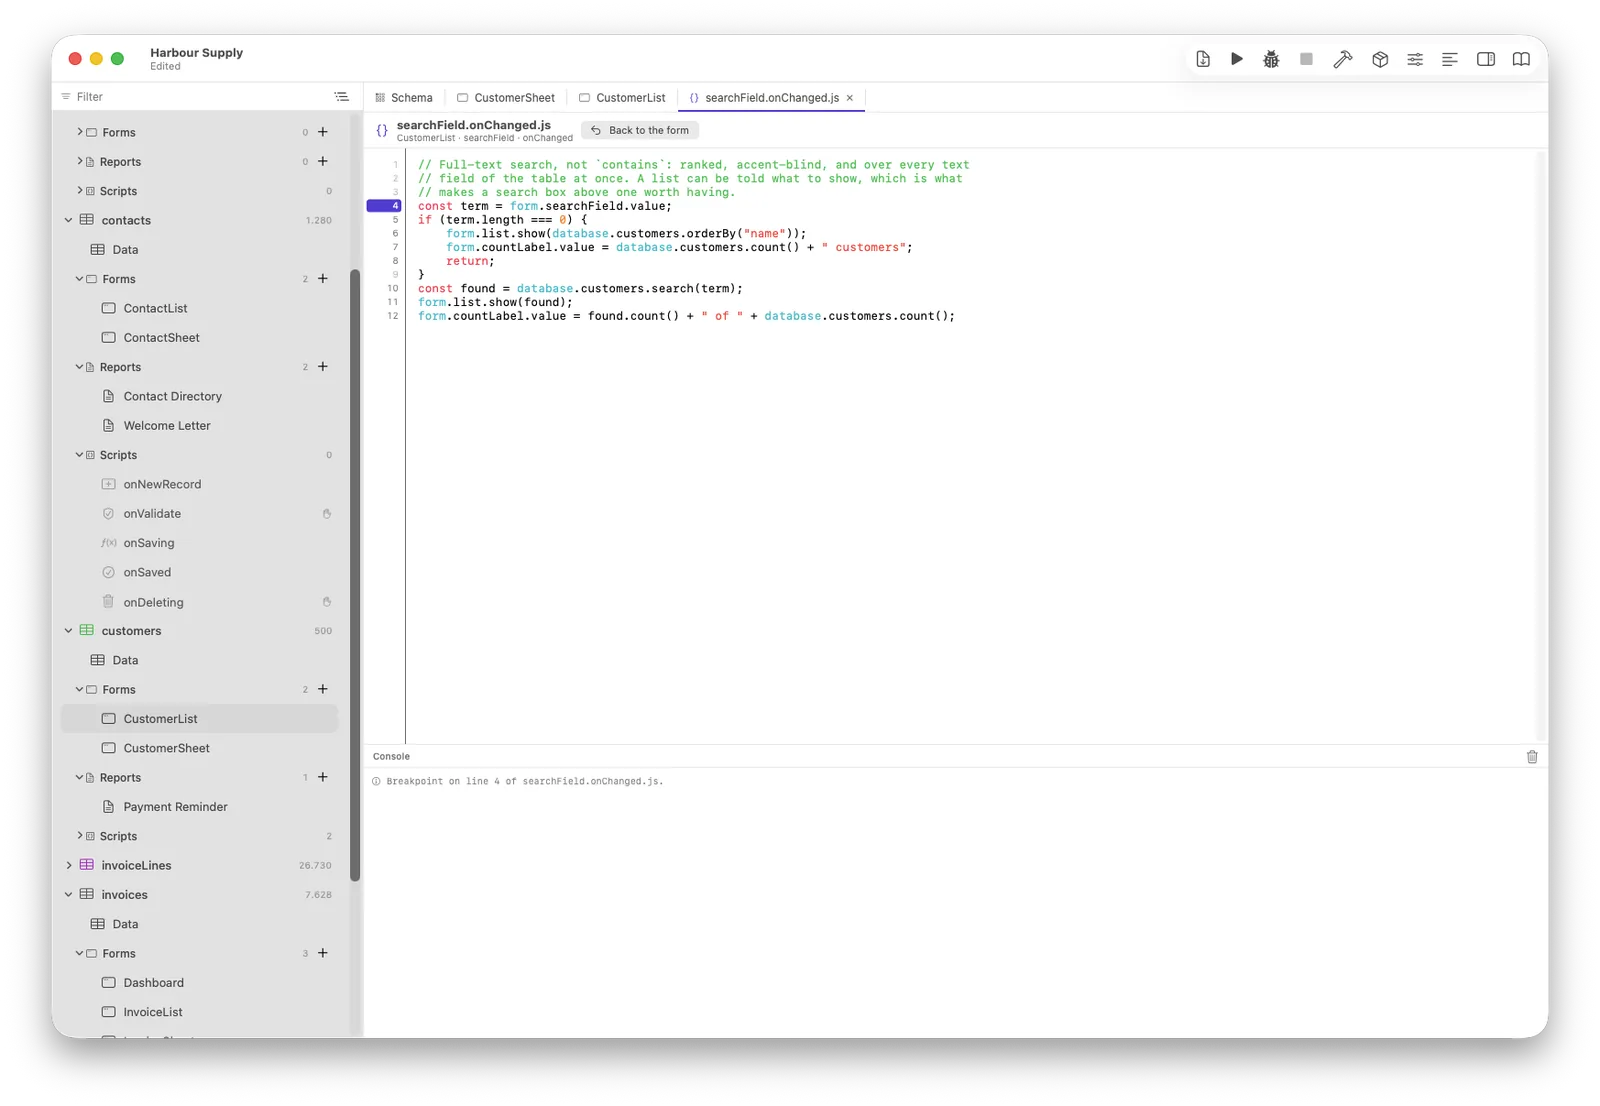
Breakpoints
Click the gutter. A breakpoint can carry a condition
(record.total > 10000) and a hit count — the crash on
the 400th row is reachable without 399 clicks of Continue. A forgotten
pause() in a script refuses the build, so it cannot ship.
Stepping and seeing
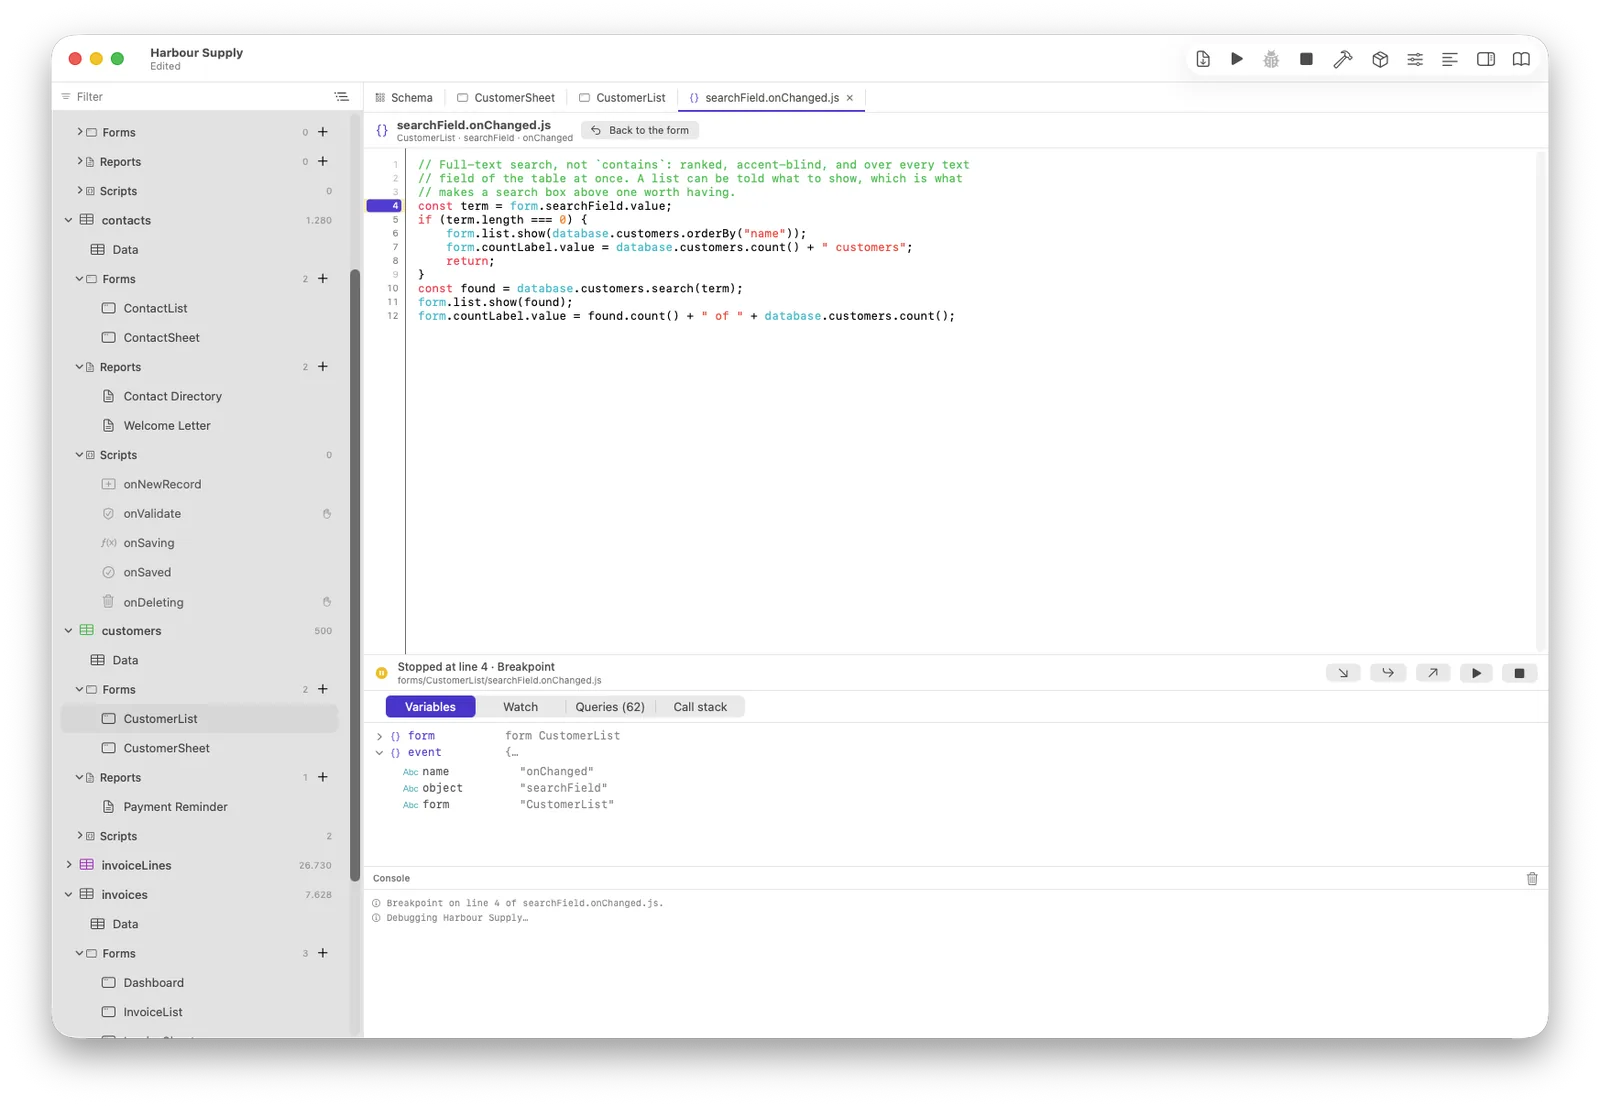
Step, Step Over, Step Out. Variables open up — records show their fields, arrays their elements. The script, its line, and the whole scope: what you would ask a colleague to describe over the phone, on screen.
The query log
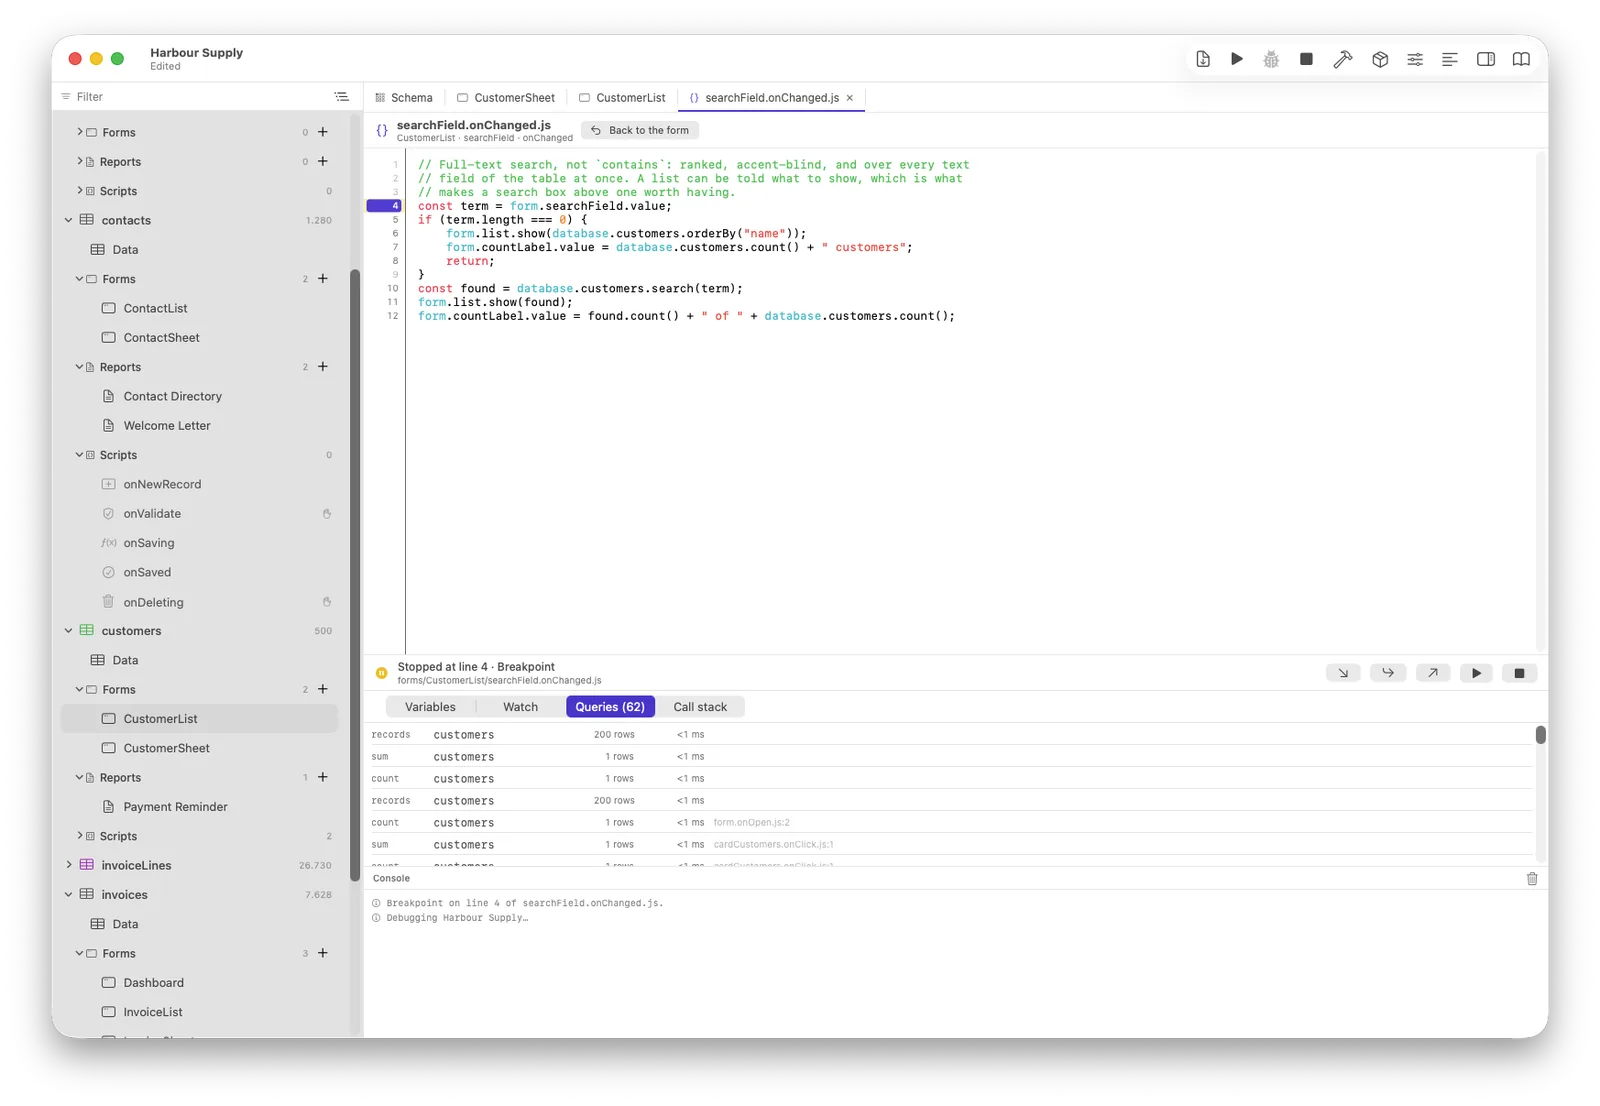
Every query the running application makes, in order, with its row count
and time. This is where an N+1 loop becomes visible: four thousand
one-row queries in a straight column are unmistakable — and the fix
(count(), a narrowed query, a computed field) is usually one
line. The lazy attachment reads appear here too, so a list secretly opening
documents is just as visible.
Watching one expression, and who called this
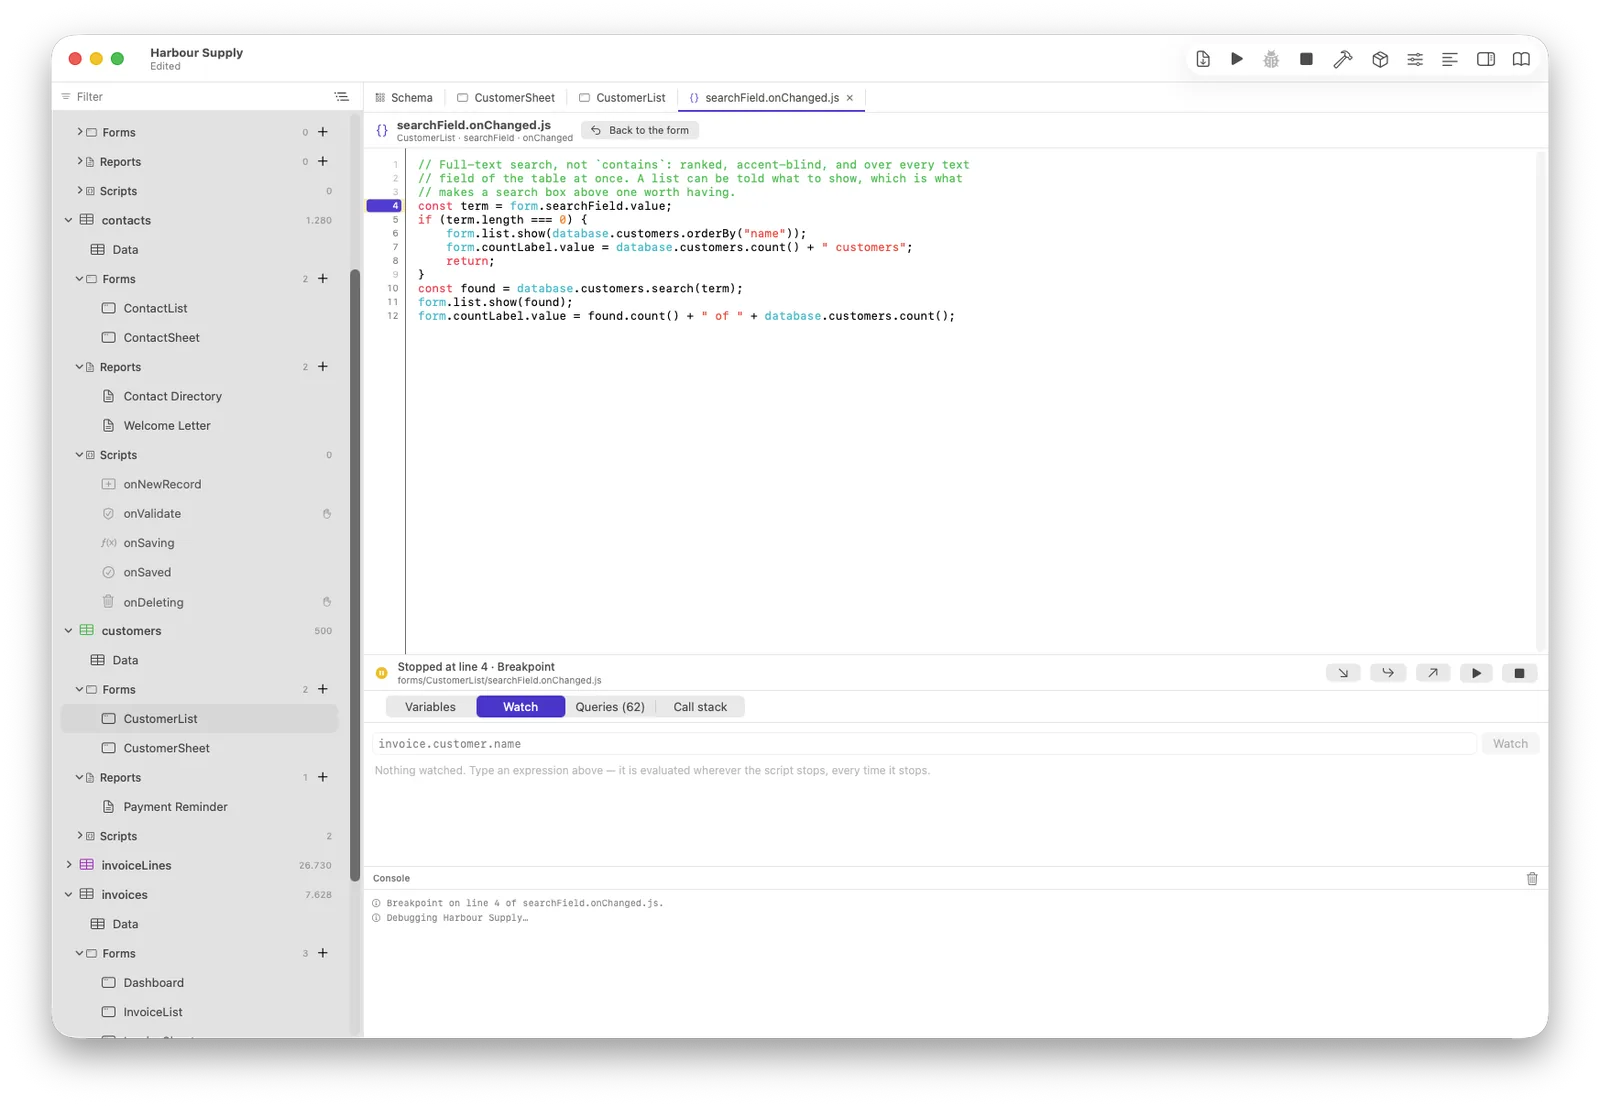
Two more tabs beside the variables. Watch takes an expression —
invoice.customer.name, form.list.count() — and evaluates
it wherever the script stops, every time it stops: the way to follow one
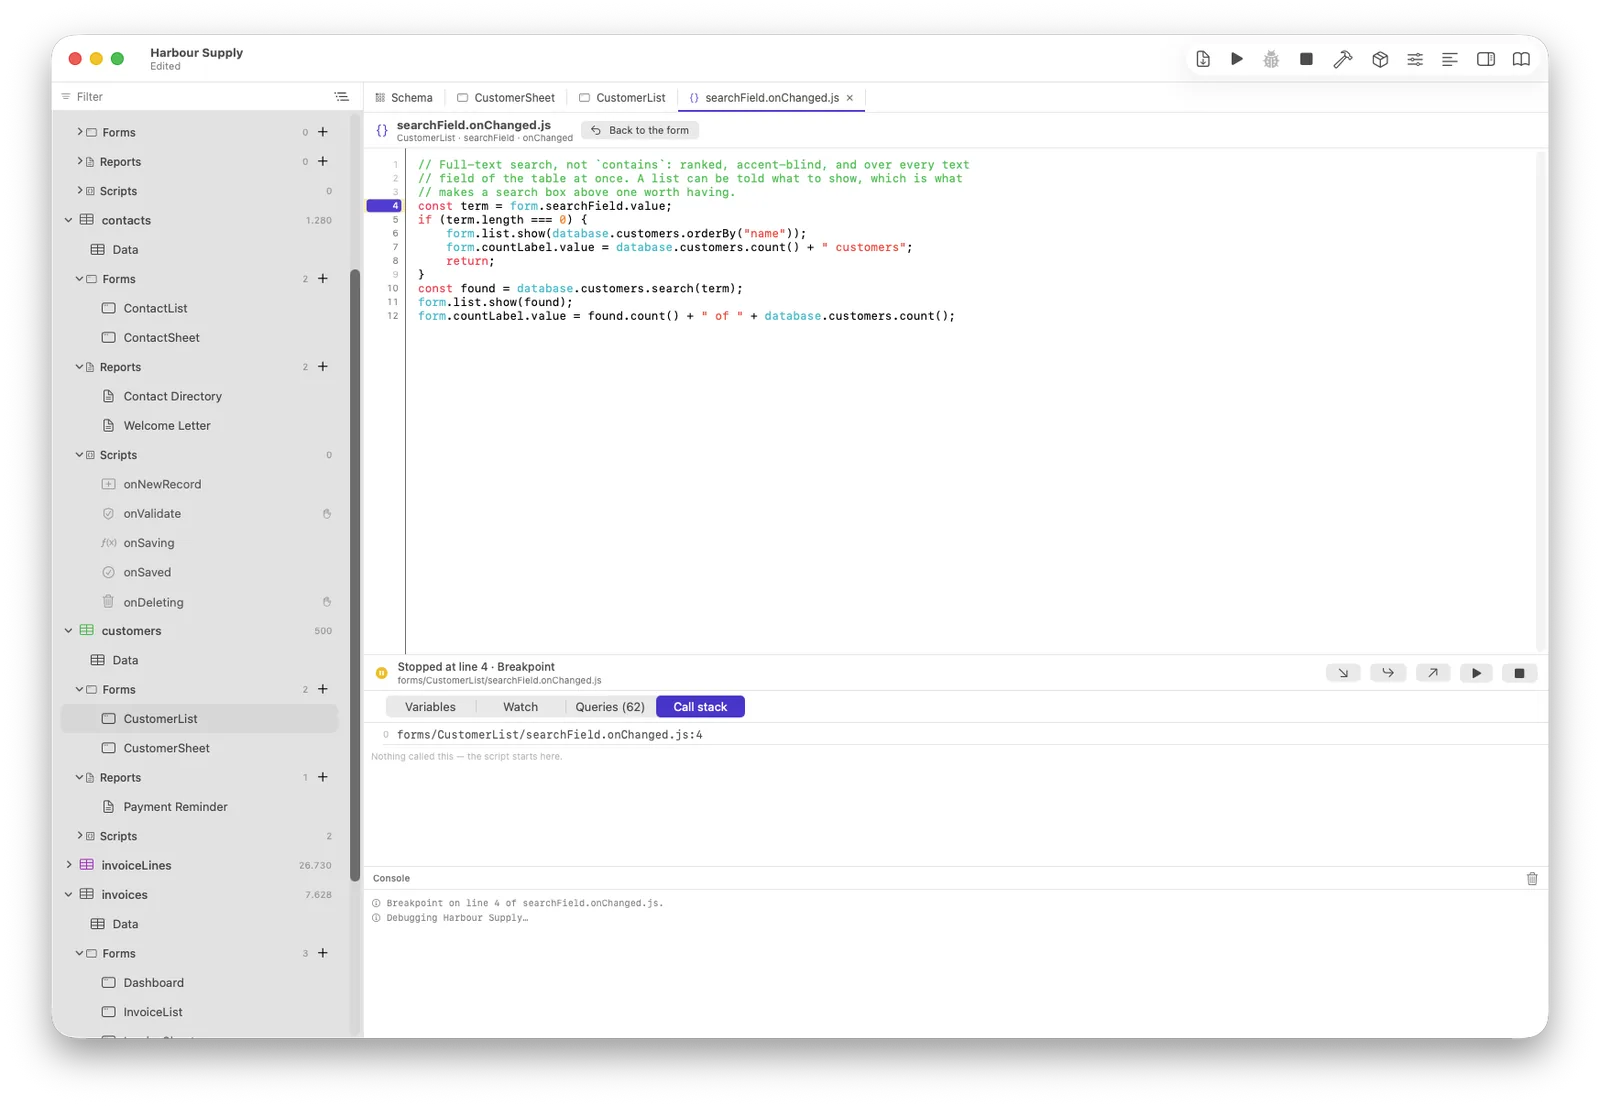
value through a loop without opening the scope at each pass. Call stack
answers the other question — how did we get here — and says so plainly when the
answer is “nobody”: an event script called by the window itself is the
top of its own stack.
The post-mortem
When a script throws, the debugger shows the moment of death — the line, the file, the variables as they were — even though nothing was paused. One look usually replaces a quarter of an hour of guessing.